Demo APP --> https://share.streamlit.io/maximilianfreitag/yt-livechat-analysis/main/example.py
GOOGLE COLAB file (Same code but works everytime) --> https://colab.research.google.com/drive/1lUkc92nJoa-VO8-1whUx5LT_XyD_pzrW?usp=sharing
Second GOOGLE COLAB file if you want to collect a real ongoing LIVE chat not only the replay (Change the ID and press play --> https://colab.research.google.com/drive/15sPeuAkv6hJunklK0wRLZDBZA-jP1eNy?usp=sharing
-
Git clone the repository to your Desktop and install streamlit and the necessary modules pytchat and plotly via pip
git clone https://github.com/MaximilianFreitag/yt-livechat-analysis.git
pip install streamlit
pip install pytchat
pip install plotly
-
cd into the folder "yt-livestream" on your desktop
cd yt-livestream -
Run the file "example.py" in the folder with:
streamlit run example.py
-
The file now runs locally on your machine
To-Do:
- Streamlit only has a limited runtime for single functions. My function ...main()... stops collecting messages after 15 mins because of that (Note to myself: One of the streamlit creators told me that web sockets don't run that long in general)
- If the user hits stop on the app the "Collecting data" symbol is still visible
- Streams where people sent too many messages before the stream started like (-1h 50m) causes the app to collect the messages really slowly
- Messages that were posted over one hour before the stream started are not properly handled by the get_minutes() function. E.g. the timestamp -2:12:42 will not be turned into -212 (desired output) by the function... -59:42 --> -59 .... -1:44:04 --> ??? doesn't work and it should return -144. As a result, the plot function ignores those values.
__________________________________________________
- I want to add additional text boxes for the user to input custom words e.g. spam ... eggs ...that will be displayed in a sparate graph for the results. So the user sees "Oh, the word spam was mentioned 42 times in minute 33 and eggs was mentioned 7 times in minute 55".
- I want to add spacing for the mobile version. Currently just writing something like st.write(' ') or using line breaks like br 'doesn't work for mobile
- Display the most current 5 collected messages while the data is being collected (Note to myself: Use streamlit's st.empty for collapsing)
- Make the theme of the app white, currently it depends on the users settings if the app appears in light or dark mode. Adding a .config file changes that
- Getting rid of the timestamp when the user accidentally pastes in a URL + timestamp... e.g. URL ends with &t=2195s
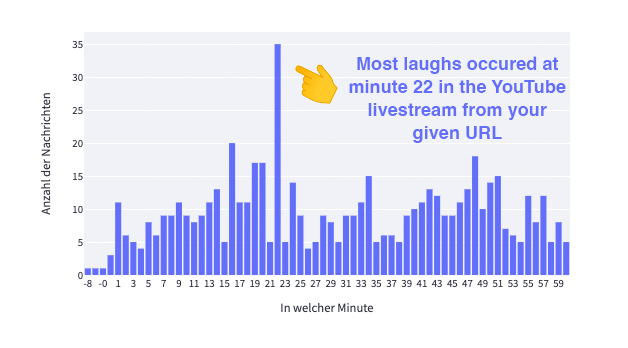
- Add a hyperlink to each graph where the max. occurences took place, e.g. This is where the most laughs occured --> https:// ....timestamp (Note to myself: Add a function that transforms the minute back to seconds, also take care of 1 hour time marks... current code transforms 60 mins to 100 (1:00:00))
- Add a sentiment analysis with the help of the module "huggingface transformers". So the user sees "oh, from minutes 12 to 21 the chat was overall pretty happy, at minute 30 the chat was really hateful". (Note to myself: I wrote a ipynb notebook that has this code, just add it, but does sentiment analysis makes sense overall?)
- Add the top 3 users that commented most often rather than only the user with the max. messages
- Exclude other bots from the collected users. (Nightbot, ....)
