
lspwatch is a configurable stdin/stdout proxy for the Language Server Protocol (LSP) with built-in observability integrations. lspwatch produces telemetry for the language server and its LSP request/response communication, and exports it to your observability backend.
lspwatch can calculate and export:
- Request duration: how long it takes for the language server to respond to code completion, hover, go-to-definition, etc requests from the editor.
- Language server resident-set size (RSS): how much memory the language server is actively using.
Users can optionally choose to tag metrics with:
language_server: name of language server binary (e.gclangd).user: username on the machine.os: operating system.ram: total amount of RAM on the machine.
If you work on a sufficiently complex typed codebase, you'll find that language support features within modern editors like code completion, diagnostics, suggestions, etc. can become considerably slow. Much of the universally hated sluggishness of code editors is due in large part to these language features. To provide codebase-wide awarness, editors rely on language servers to provide answers to code queries by scanning the codebase and maintaining internal state representations.
To quantify this sluggishness, we can monitor how editors interact with language servers. The duration of an LSP request can tell us how responsive an editor feels. More specifically, this metric can tell us how much (likely idle) time the developer spends waiting for their editor to respond to their edit.
What we essentially have is a real-time, constant, and accurate indicator of developer experience and productivity. I have worked on DevEx teams with access to this kind of data, and it's proven essential for managing the local development experience at scale.
With lspwatch, you get metrics related to the responsiveness of your editor, tagged with contextual details to help with analysis. You can split your metrics by machine configuration, operating system, even down to the user, and more! lspwatch can help you with:
- Evaluating and improving modularization in your codebase: The nature of the dependency graph will typically impact language server performance.
- Monitoring the impact of language version upgrades on the coding experience: Any immediate improvements or regressions in language server performance can be noticed and acted on quickly.
- Identifying potentially misconfigured local development setups or faulty machines.
- Spotting general usage trends in code editors.
lspwatch is available only for MacOS and Linux. The easiest way to install it is via a Homebrew tap:
brew install noredeen/tap/lspwatchAlternatively, you can install executables from the releases page.
Prerequisites:
- Go
1.23.x. - make.
Install the project dependencies with make deps, and run sudo make install to build and install lspwatch. If you just want to build the project, you can run make build. To uninstall lspwatch, run sudo make uninstall.
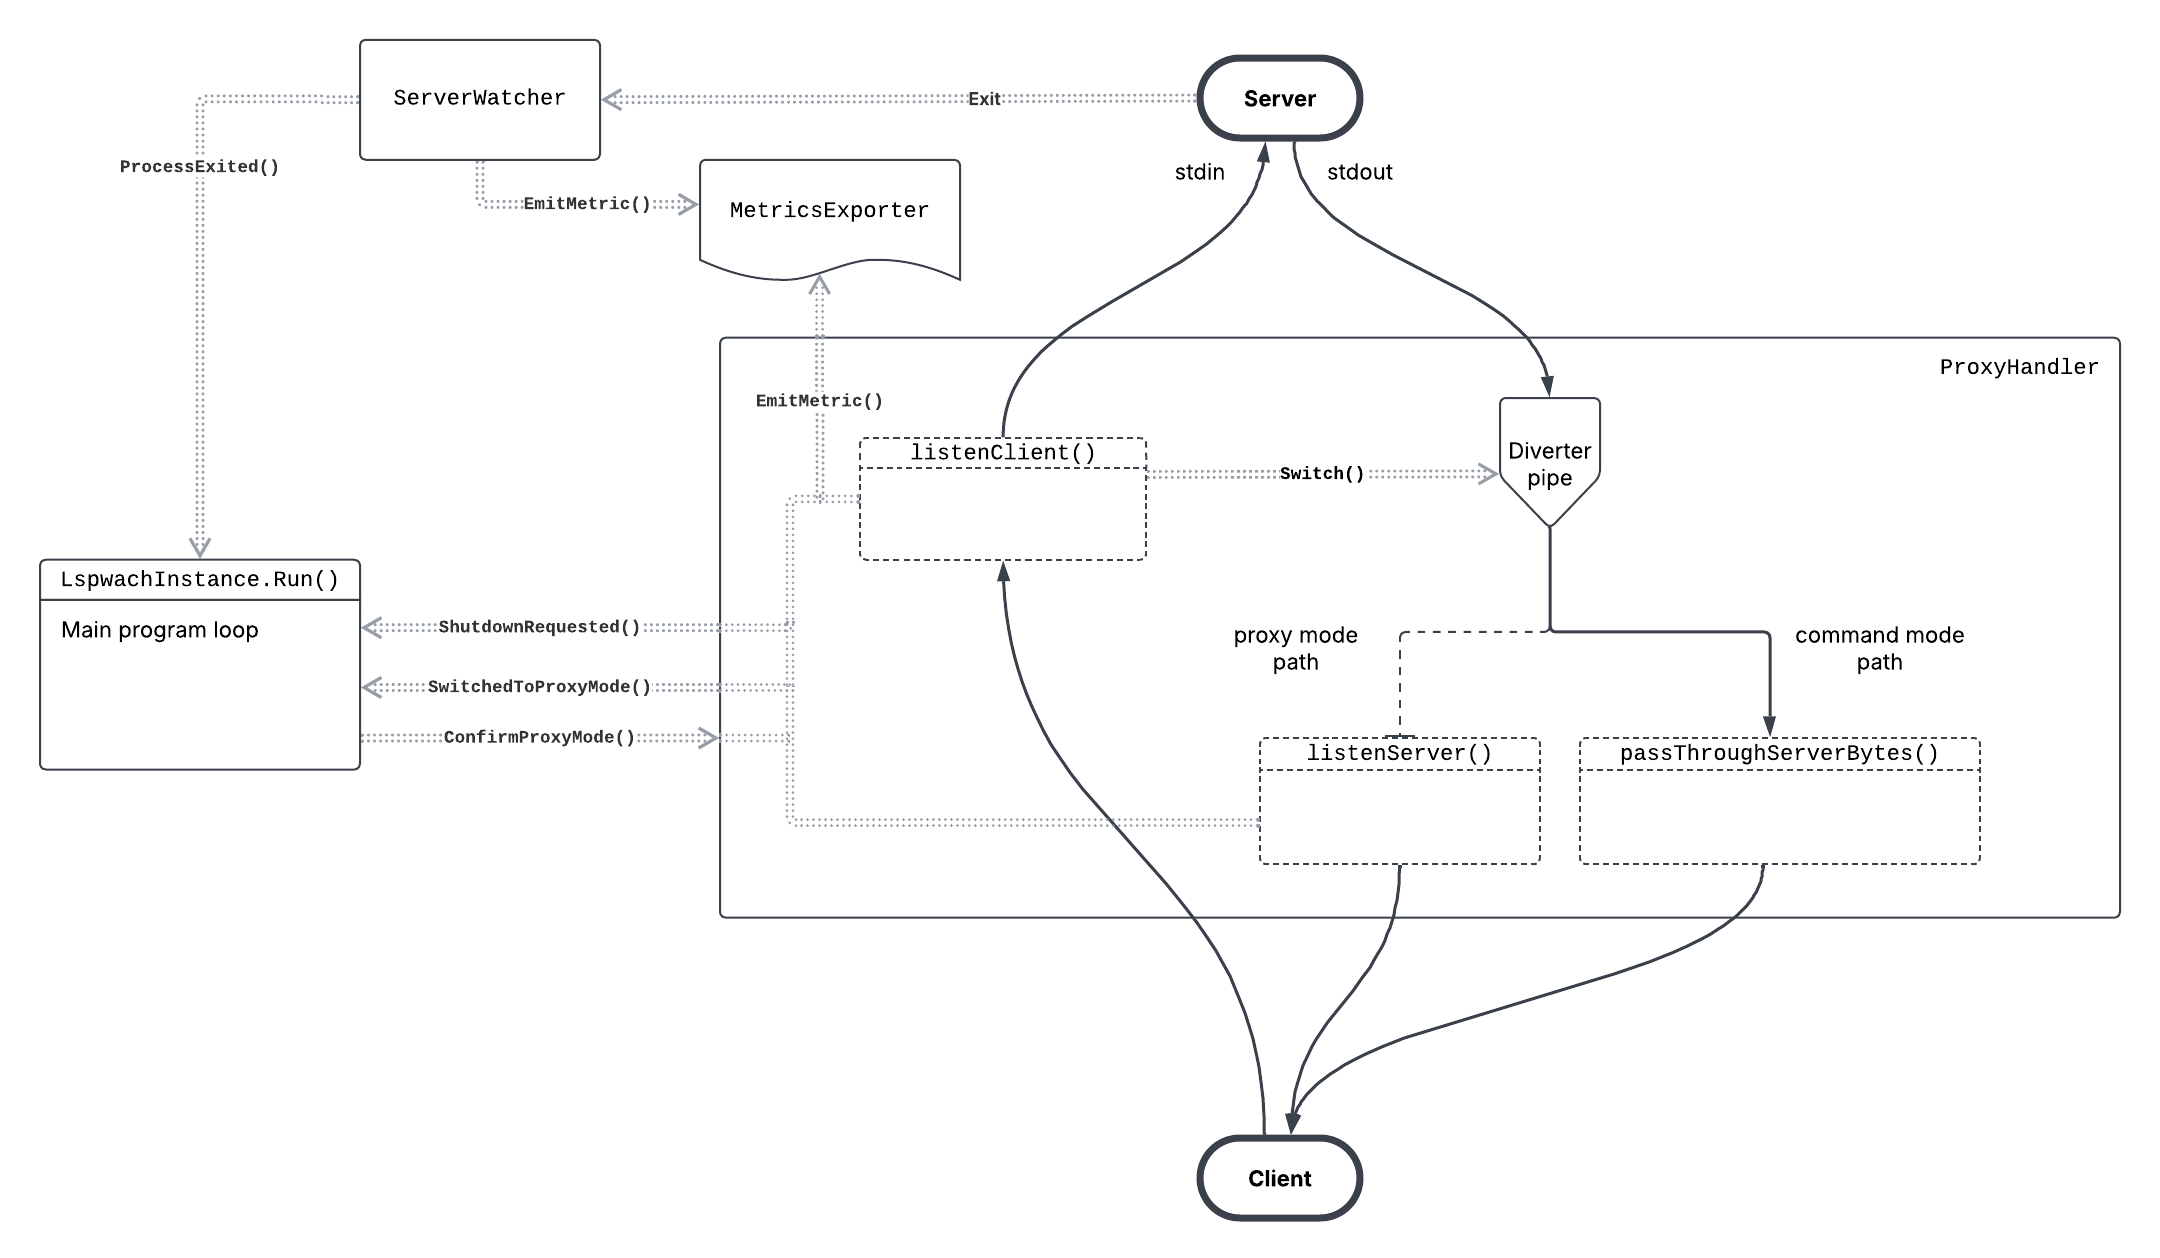
lspwatch is an executable that transparently stands in place of the language server. lspwatch operates in one of two modes:
commandmode: For running one-time language server queries likegopls stats, where the command exits after returning results. Editors often use such queries to gather static metadata.proxymode: For long-running language server sessions where LSP messages are continuously exchanged. This is the typical usage of the language server.
lspwatch will automatically choose the correct mode, but you can also specify it using the --mode flag (e.g lspwatch --mode command -- gopls stats). You should never need to do this.
Generally, to use lpswatch for instrumenting your language server, you will need to replace the command your code editor invokes when running the language server. For example, instead of running gopls <args>, your editor should run lspwatch -- gopls <args>. Most LSP-equipped editors will have a way to configure this. Some verified examples are included below, but reference the documentation of your editor or language extension for instructions.
(Golang) Neovim + nvim-lspconfig
/path/to/instrumented_gopls:
#!/bin/bash
lspwatch -- gopls "$@"init.lua:
gopls = {
  cmd = {
    "/path/to/instrumented_gopls"
  }
}
(Golang) VSCode + vscode-go
/path/to/instrumented_gopls:
#!/bin/bash
lspwatch -- gopls "$@".vscode/settings.json:
{
    "go.alternateTools": {
        "gopls": "/path/to/instrumented_gopls"
    }
}lspwatch offers a set of pre-defined metrics. Some metrics will have tags/attributes which others don't. In your observability backend, every metric name will be prepended with lspwatch..
Options:
request.duration(In your observability backend:lspwatch.request.duration)- Special tags:
method-- name of the LSP request method.
- Special tags:
server.rss- Special tags: None.
lspwatch can be configured with a YAML file. Use the --config or -c flag to specify the path. Fields which allow ENV variable expansion can include references to environment variables in the form $ENV_VAR or ${ENV_VAR}.
| YAML field | Type | Required? | ENV variable expansion? | Description |
|---|---|---|---|---|
project |
string | ✗ | ✗ | Name of the project/repository the language server will operate on. All metrics will be tagged with this value, if provided. |
exporter |
string | ✓ | ✗ | Either: datadog or opentelemetry. |
env_file |
string | ✗ | ✗ | Path to a .env file containing environment variables relevant to lspwatch. |
metrics |
[]string | ✗ | ✗ | The metrics emitted by lspwatch. Default: all available metrics. Options: request.duration, server.rss. |
tags |
[]string | ✗ | ✗ | Additional tags to include with all metrics. Default: none. Options: user, os, language_server, ram. |
metered_requests |
[]string | ✗ | ✗ | Method names of the LSP requests to monitor/measure. Default: initialize, textDocument/references, textDocument/hover, textDocument/documentSymbols, textDocument/completion, textDocument/diagnostic, textDocument/signatureHelp. Options: LSP docs. |
polling_interval |
int | ✗ | ✗ | Interval in seconds for polling language server stats (e.g RSS). Default: 5s. Options: 1 <= t <= 1000. |
opentelemetry |
object | If exporter is opentelemtry |
See below. | |
datadog |
object | If exporter is datadog |
See below. |
| YAML field | Type | Required? | ENV variable expansion? | Description |
|---|---|---|---|---|
protocol |
string | ✓ | ✗ | The protocol used by the OpenTelemetry exporter. Options: grpc, http, file. |
directory |
string | If protocol is file |
✗ | The directory where lspwatch will store OpenTelemetry metrics files. |
endpoint |
string | If protocol is grpc or http |
✗ | The OpenTelemetry endpoint, without a path or scheme. Example: localhost:4317. |
tls |
object | ✗ | ✗ | TLS configuration for the connection to the OpenTelemetry endpoint. |
compression |
string | ✗ | ✗ | Compression scheme for grpc and http requests. Options: gzip. |
headers |
object; string key-value pairs | ✗ | ✓ | Headers to include in the grpc and http requests. |
timeout |
int | ✗ | ✗ | grpc and http request timeout. |
| YAML field | Type | Required? | ENV variable expansion? | Description |
|---|---|---|---|---|
client_api_key |
string | ✓ | ✓ | Value for Datadog authentication. |
client_app_key |
string | ✓ | ✓ | Value for Datadog authentication. |
exporter_batch_size |
int | ✗ | ✗ | The max number of metrics batched by the exporter before flushing to Datadog. |
exporter_batch_timeout |
int | ✗ | ✗ | The max time between batch flushes to Datadog. |
site |
string | ✗ | ✗ | Datadog site. More info in the Datadog docs. |
disable_compression |
boolean | ✗ | ✗ | Disables HTTP request compression, which is enabled by default. |
| YAML field | Type | Required? | ENV variable expansion? | Description |
|---|---|---|---|---|
insecure |
boolean | ✗ | ✗ | Disables client transport security. |
insecure_skip_verify |
boolean | ✗ | ✗ | Controls whether a client verifies the server's certificate chain and host name. |
ca_file |
string | ✗ | ✗ | Path to a CA file. |
cert_file |
string | ✗ | ✗ | Path to a certificate file. |
key_file |
string | ✗ | ✗ | Path to a key file. |
Running lspwatch without a config file is equivalent to using the following config:
exporter: opentelemetry
opentelemetry:
  protocol: file
  directory: ./
i.e lspwatch will append OpenTelemetry metrics to a file inside the working directory.
Warning
lspwatch does not yet support output file rotation, so the metrics file will grow in size without bound as metrics get emitted.
Contributions are welcomed and a contributing guide is in the works. Refer to the installation section for steps to build from source.
Architecture of lspwatch
- File rotation for logs and OTel local exports.
- Support for
tsserverprotocol. - New metric: Number of language server crashes.